Confirming you are not from the U.S. or the Philippines

Bằng cách đưa ra quyết định này, tôi tuyên bố rõ ràng và xác nhận rằng:
  • Tôi không phải là công dân hoặc cư dân Hoa Kỳ
  • Tôi không phải là cư dân của Philippines
  • Tôi không trực tiếp hoặc gián tiếp sở hữu hơn 10% cổ phần/quyền biểu quyết/lợi ích của cư dân Hoa Kỳ và/hoặc không kiểm soát công dân hoặc cư dân Hoa Kỳ bằng các phương thức khác
  • Tôi không thuộc quyền sở hữu trực tiếp hoặc gián tiếp hơn 10% cổ phần/quyền biểu quyết/lợi ích và/hoặc dưới sự kiểm soát của công dân hoặc cư dân Hoa Kỳ được thực hiện bằng các phương thức khác
  • Tôi không liên kết với công dân hoặc cư dân Hoa Kỳ theo Mục 1504(a) của FATCA
  • Tôi nhận thức được trách nhiệm của mình khi khai báo gian dối.
Theo mục đích của tuyên bố này, tất cả các quốc gia và vùng lãnh thổ phụ thuộc của Hoa Kỳ đều ngang bằng với lãnh thổ chính của Hoa Kỳ. Tôi cam kết bảo vệ và giữ cho Octa Markets Incorporated, giám đốc và cán bộ của công ty vô hại chống lại bất kỳ khiếu nại nào phát sinh từ hoặc liên quan đến bất kỳ hành vi vi phạm tuyên bố nào của tôi bằng văn bản này.
Chúng tôi trú trọng quyền riêng tư và bảo mật thông tin cá nhân của bạn. Chúng tôi chỉ thu thập email để cung cấp các ưu đãi đặc biệt và thông tin quan trọng về sản phẩm và dịch vụ của chúng tôi. Bằng cách gửi địa chỉ email của bạn, bạn đồng ý nhận những bức thư như vậy từ chúng tôi. Nếu bạn muốn hủy đăng ký hoặc có bất kỳ câu hỏi hoặc thắc mắc nào, hãy viết thư cho Hỗ trợ Khách hàng của chúng tôi.
Octa trading broker
Mở tài khoản giao dịch
Back

AUD/USD price Analysis: Volatility contracts amid Descending Triangle formation

  • AUD/USD jumps to near 0.6650 ahead of US core PCE Inflation data.
  • The US Dollar weakens as a downwardly revised Q1 GDP keeps hopes of the Fed cutting rates at least once this year on the table.
  • Australia’s hot CPI report for April pushes back RBA’s rate-cut prospects.

The AUD/USD pair climbs to near 0.6650 in Friday’s London session. The Aussie asset strengthens as the US Dollar weakens ahead of United States core Personal Consumption Expenditure Price Index (PCE) data for April, which will be published at 12:30 GMT.

The US core PCE Inflation will provide cues about when the Federal Reserve (Fed) will start reducing interest rates. Currently, financial markets are mixed about September’s policy meeting.

Economists expect that core PCE inflation rose steadily by 0.3% and 2.8% monthly and annually, respectively.

The US Dollar Index (DXY) seems vulnerable near day’s low around 104.65. The near-term outlook of the US Dollar turned uncertain after US Bureau of Economic Analysis (BEA) reported its second estimates report for Q1 Gross Domestic Product (GDP) that the economy expanded at a slower pace of 1.3% due to lower consumer spendings from the preliminary estimates of 1.6%.

Meanwhile, the Australian Dollar’s appeal is upbeat as hot monthly Consumer Price Index (CPI) data for April has forced traders to pare Reserve Bank of Australia’s (RBA) early rate-cut bets. Annually, price pressures rose at a higher pace of 3.6% than estimates of 3.5% and the former reading of 3.4%.

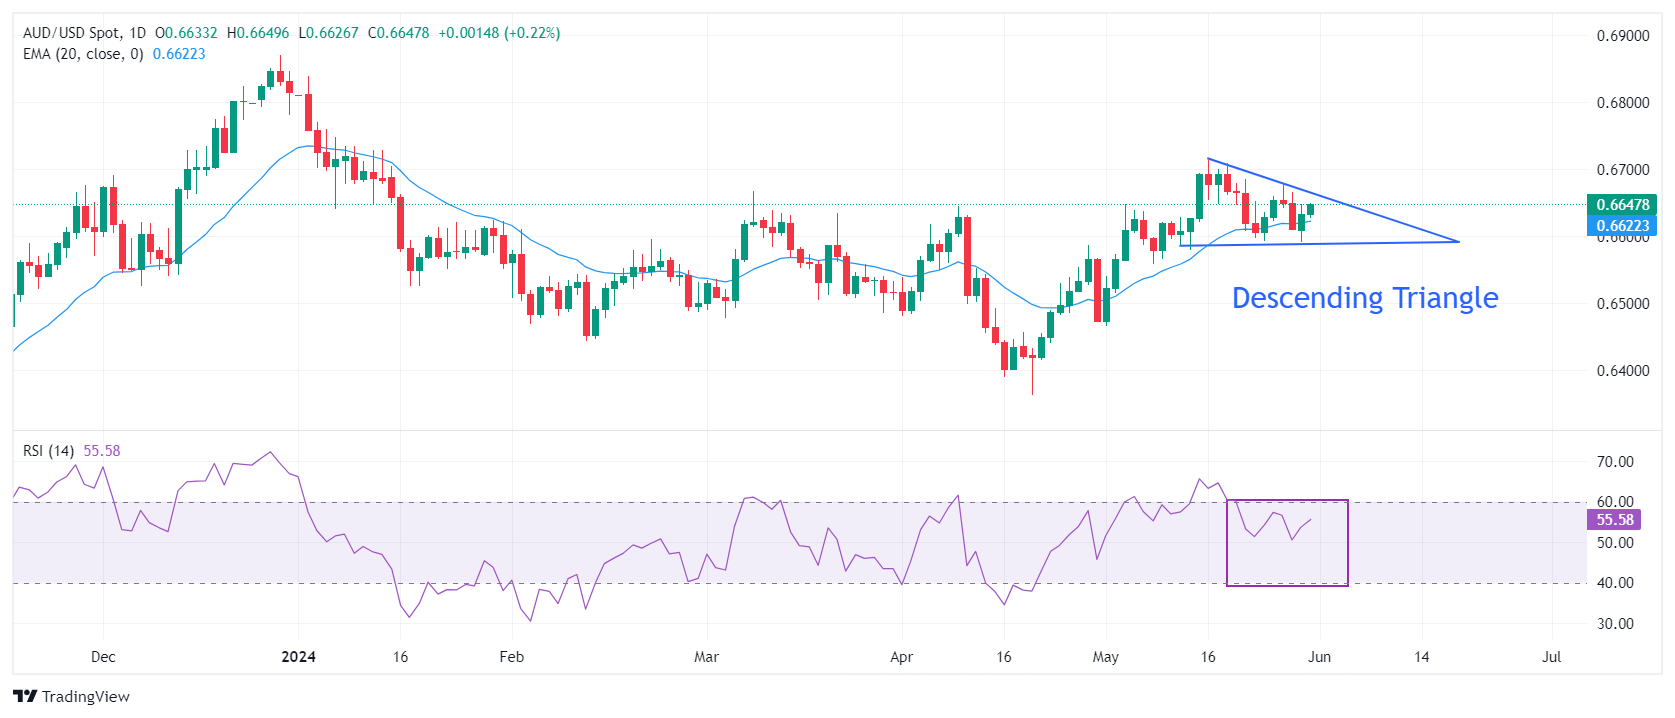
AUD/USD advances toward the downward-sloping border of the Descending Triangle chart pattern, which is plotted from May 16 high at 0.6714, formed on a daily timeframe. The horizontal support of the above-mentioned chart formation is marked from May 13 low at 0.6586.

Upward-sloping 20-day Exponential Moving Average (EMA) near 0.6620 suggests that the near-term trend is bullish.

The 14-period Relative Strength Index (RSI) oscillates in the 40.00-60.00 range, indicating a sharp volatility contraction.

Going forward, a decisive move above May’s high at 0.6714 will drive the asset towards January 3 high at 0.6771 and the round-level resistance of 0.6800.

Alternatively, a downside move would appear if the major breaks below May 14 low at 0.6580, which will expose it to May 1 high at 0.6540, followed by the psychological support of 0.6500.

AUD/USD daily chart

AUD/USD

Overview
Today last price 0.6647
Today Daily Change 0.0014
Today Daily Change % 0.21
Today daily open 0.6633
 
Trends
Daily SMA20 0.6633
Daily SMA50 0.6561
Daily SMA100 0.6559
Daily SMA200 0.6535
 
Levels
Previous Daily High 0.6647
Previous Daily Low 0.6591
Previous Weekly High 0.6709
Previous Weekly Low 0.6592
Previous Monthly High 0.6644
Previous Monthly Low 0.6362
Daily Fibonacci 38.2% 0.6626
Daily Fibonacci 61.8% 0.6612
Daily Pivot Point S1 0.66
Daily Pivot Point S2 0.6567
Daily Pivot Point S3 0.6543
Daily Pivot Point R1 0.6657
Daily Pivot Point R2 0.668
Daily Pivot Point R3 0.6713


Portugal Gross Domestic Product (YoY) above expectations (1.4%) in 1Q: Actual (1.5%)

Portugal Gross Domestic Product (YoY) above expectations (1.4%) in 1Q: Actual (1.5%)
Đọc thêm Previous

Oil hovers below $78 as OPEC looks set to maintain current output cuts

Oil prices are hovering below $78 on Friday, failing to recover from the near 3% decline in just two trading days. For the week, Crude’s performance is broadly flat and could still eke out a gain ahead of the OPEC+ meeting, which will take place on
Đọc thêm Next